

– December Market Snapshot –
- December followed the pattern set in November, with lower bond yields triggering a further rally on equity markets.
- The Australian equity market significantly outperformed the global average.
- Expectations firmed for interest rate cuts in 2024.
International Equities
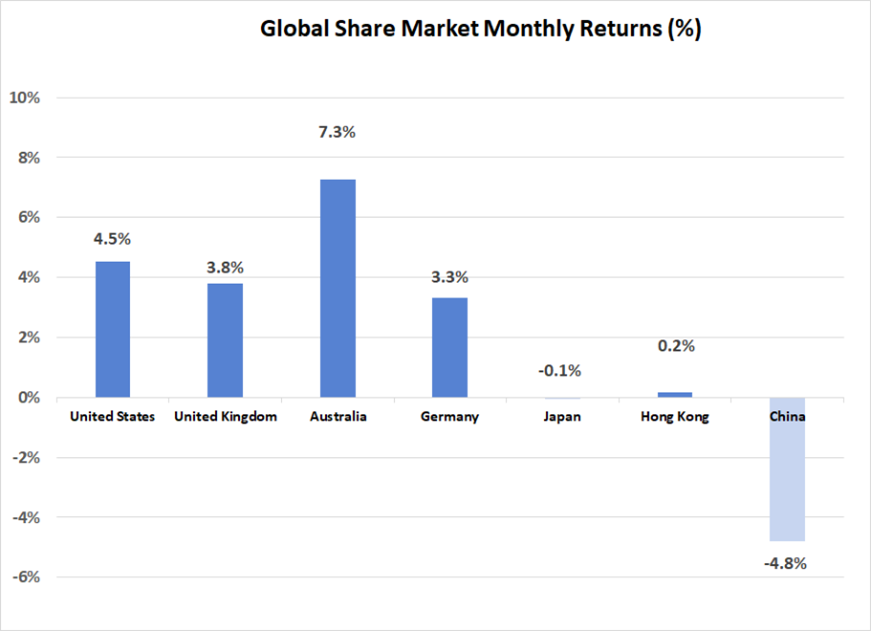
Ongoing improvements in the inflationary outlook appear to be the main driver of the current optimism on financial markets. United States inflation moved down another notch, with the annual rate measured at 3.1% for the year ended November. In addition, recent declines in the oil price were consolidated last month, with the WTI Crude Oil price falling a further 0.7% in $US terms. With the fight against inflation seemingly being won without the global economy being forced into recession, global equity markets continued to move higher over December. An increase of 3.9% in the global average resulted in the annual gain for 2023 being a very healthy 21.7%.
There was some change, however, in the sectors and stocks that led share markets higher in December. Although U.S. technology stocks have been the dominant contributor to market gains for much of the past year, December saw a swing in support towards more “value” styled equities. Larger U.S. Information Technology stocks underperformed the broader market, with outperformance coming from sectors such as financials, which had been lagging for much of the year. This switch in leadership possibly reflects a view that the technology sector has become expensive, with investors seeking better value elsewhere. A similar rationale may explain why global smaller companies outperformed larger companies by more than 4% last month, after significantly lagging larger companies over the past year.
Whereas share market gains across Europe and North America were consistent in the 3-5% range, there was underperformance in Asia, with the Japanese market flat and the Chinese market continuing to post losses. A stronger Yen weighed on Japanese export stocks, with the ongoing lack of evidence of a strong economic stimulus program in China continuing to disappoint investors. The Chinese market has now declined 12.0% over the past year. Outside of China, other emerging markets continued to perform well, with India (up 7.9%) and South Korea (up 6.0%) building on recent gains.
Australian Equities
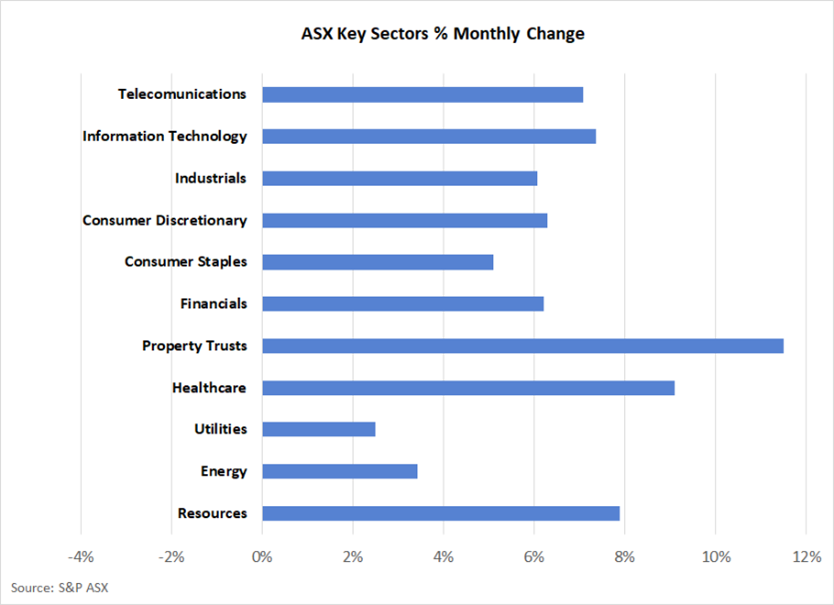
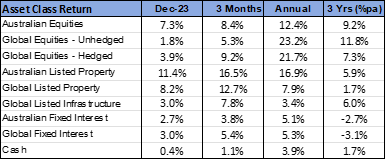
The Australian share market outperformed the global average, with the S&P ASX 200 Index jumping 7.3% last month. Contributing to this outperformance was the listed property sector, which rose 11.4%. Property investors were encouraged by the outlook for lower interest rates, which make property rental yields more attractive in relative terms. Although global listed property also rallied strongly (up 8.2%), the Australian market has a higher weighting to property and therefore benefited more significantly from the property rally.
Resource stocks also outperformed the market average. Ongoing strength in the iron price, which rose by 6.7% in December to be 19.4% higher for the year, has defied many expectations and provided support to the large Australian iron ore miners.
Fixed Interest & Currencies
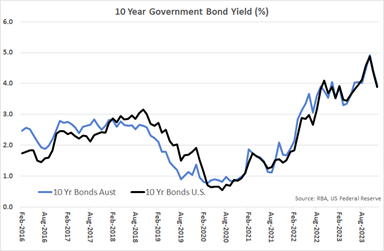
With the outlook for inflation continuing to soften, expectations have firmed that central banks will be in a position to cut interest rates over the course of 2024. As a result, longer term interest rates have fallen sharply over the past 2 months. The Australian and United States 10-year government bond yields have moved in lockstep, with yields falling by 0.5% in both November and December. The U.S. 10-year Treasury Bond is now yielding 3.88%, with the corresponding Australian yield marginally higher at 3.96%. With cash interest rates remaining steady, there has been little movement at the front end of the yield curve. The Australian cash interest rate is currently 4.35%, with the United States Federal Reserve targeting a cash rate between 5.25% and 5.5%.
The decline in longer term U.S. interest rates once again resulted in the $US losing ground, with investors receiving less compensation for holding $US risk free assets. As a result, the $A appreciated for the second consecutive month, moving from US 66.5 cents to US 68.4 cents. The $A was also stronger against the Euro (up 2.0%), but did decline 1.0% against a stronger Japanese Yen. The higher $A did dampen the positive returns generated from those global equity investments with unhedged currency exposure last month.
Outlook and Portfolio Positioning
The 2023 calendar year was one full of activity and surprises for financial markets. Most notable was the resiliency shown by the United States economy, with growth remaining robust and defying the rapid increase in interest rates. Widespread forecasts of recession did not eventuate, despite the additional challenges presented by the collapse of some large U.S. banks and the tragic events that unfolded in the Middle East. Not only did the U.S. economy continue to expand, but policy makers also achieved their desired outcome for inflation, which steadily approached target in the latter half of the year. This “goldilocks” soft landing scenario was accompanied by growing evidence that artificial intelligence was ready to transform business models and provide new sources of revenue and productivity growth. Global share markets rallied strongly as a result, with the 21.7% annual gain being above the most optimistic of expectations held at the start of the year. The 62.3% price surge in the large U.S. Information Technology sector was particularly notable.
Last year will also be remembered for the unusually high level of volatility on bond markets. With the market underestimating the strength of the economy, there was also an underestimation of the magnitude of monetary policy tightening that could be accommodated. Traditional economic theory then suggested that if the economy was strong, interest rates would have to remain high for an extended period in order to control inflation. This resulted in bond yields rising sharply until early November, when there was a realisation that traditional theory was not holding, and inflation was rolling over despite the strength of the economy. Yields then declined rapidly, producing significant capital gains for bond investors.
The magnitude of the rally on equity markets over 2023, and more recently only bond markets, has presented a challenging environment for investors at the start of 2024. Valuations have already responded significantly to the promise of the “soft landing”, which has reduced the scope for further gains this year. The risk that a recessionary environment has been delayed, rather than avoided, cannot be ignored; nor can the risk that further declines in inflation prove much more difficult to achieve than they have over recent quarters.
For Australian investors, differences between the state of the Australian and U.S. economies need to be acknowledged. Although financial markets in both economies have enjoyed buoyant conditions of late, growth in the Australian economy is fundamentally weaker than that of the U.S., whereas inflation is higher here. With Australian cash interest rates 1% below those of the U.S., there is arguably less scope for an easing in monetary policy in Australia, which could prove to be a source of disappointment for both bond and equity markets.
Notwithstanding the risks highlighted above, there is minimal evidence of dysfunction in financial markets or the broader global economy. Unemployment is generally low, wages growth contained and corporate balance sheets in strong health. With this backdrop, and the possibility of an eventual recovery in the Chinese economy, company earnings could drive share markets higher in the year ahead. Portfolios should therefore hold at least a “neutral” allocation to equity markets, with a focus on active mangers that can exploit some of the remaining pockets of “value”. Areas such as smaller companies and emerging markets, which didn’t enjoy the same rate of price ascendency as the broader market over the past year, may provide the greatest scope for gain in the year ahead.
Important Information
The following indexes are used to report asset class performance: ASX S&P 200 Index, MSCI World Index ex Australia net AUD TR, MSCI World ex Australia NR Hdg AUD, FTSE EPRA/NAREIT Developed REITs Index Net TRI AUD Hedged, Bloomberg AusBond Composite 0 Yr Index, Barclays Global Aggregate ($A Hedged), Bloomberg AusBond Bank Bill Index, S&P ASX 300 A-REIT (Sector) TR Index AUD, S&P Global Infrastructure NR Index (AUD Hedged), CSI China Securities 300 TR in CN, Deutsche Borse DAX 30 Performance TR in EU. Hang Seng TR in HKD, MSCI United Kingdom TR in GBP, Nikkei 225 in JPY, S&P 500 TR in USD.
General Advice Disclaimer
Any advice contained in this document is of a general nature only and does not take in to account the objectives, financial situation or needs of any particular person. Any decision to invest in products mentioned in this document should only be made after reviewing the relevant Product Disclosure Statements. Past performance is not a reliable indicator of future performance. Varria Pty Ltd is an authorised representative of Charter Financial Planning ABN 35 002 976 294 AFSL number 234665