

– May Market Snapshot –
- Share markets rebounded in May following April’s decline.
- Slightly better than expected inflation results in the U.S. led to lower bonds yields.
- The $A strengthened over the month, despite further signs of economic weakness locally.
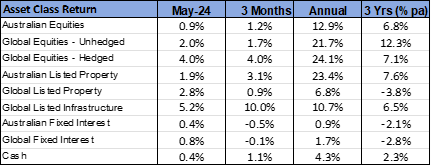
International Equities
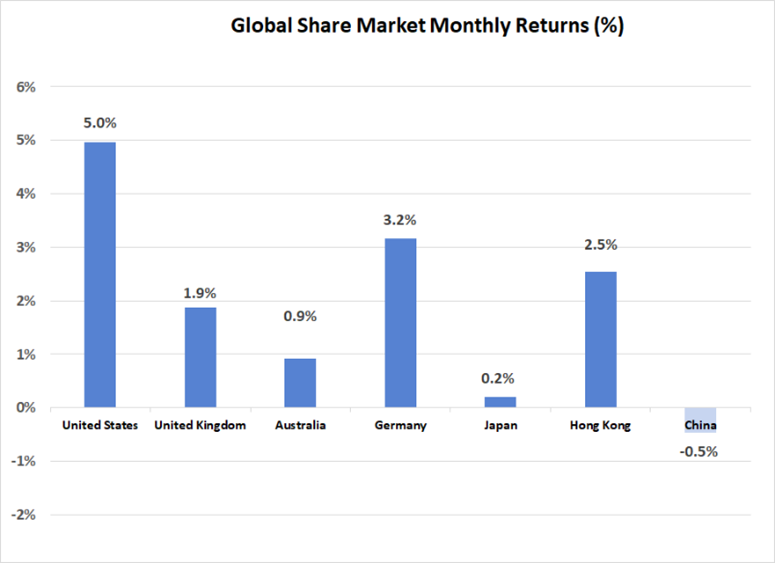
A combination of lower bond yields and positive quarterly U.S. company earnings results saw the U.S. lead global equity markets higher last month. The U.S. S&P 500 Index was 5.0% higher over May. Technology stocks were the major source of gain on the U.S. market. Support for the sector was buoyed by computer chip manufacturer, Nvidea’s, quarterly results, which showed earnings some 15% ahead of expectations. Gains outside of the U.S. were less impressive, although all major markets finished in positive territory with expectations of lower interest rates in the U.K and Europe supporting sentiment. Japan was the weakest of the major markets, with the Nikkei Index rising just 0.2%. Further weakness in the Japanese Yen (which has depreciated 15% against the $A over the past year), is placing some pressure on the Bank of Japan to increase interest rates from abnormally low levels as their domestic inflation shifts higher. Japan’s 10-year bond yield rose above 1%, which is the highest level for 11 years and reflects the expectation that monetary policy will be tightened.
Although the Hong Kong share market gained 2.5%, mainland Chinese equities had their first negative month in 4 months. News of increased tariffs imposed by the U.S. on Chinese imports, particularly on electronic vehicles, may have contributed to the small decline in share prices over May. Other emerging market results were mixed, with the Indian market rising 0.5% ahead of their national election.
Lower bond yields supported both property and infrastructure. Global listed infrastructure rallied 5.2% over the month and has been the best performed of the major asset classes over the past quarter with a 10.0% gain.
Australian Equities
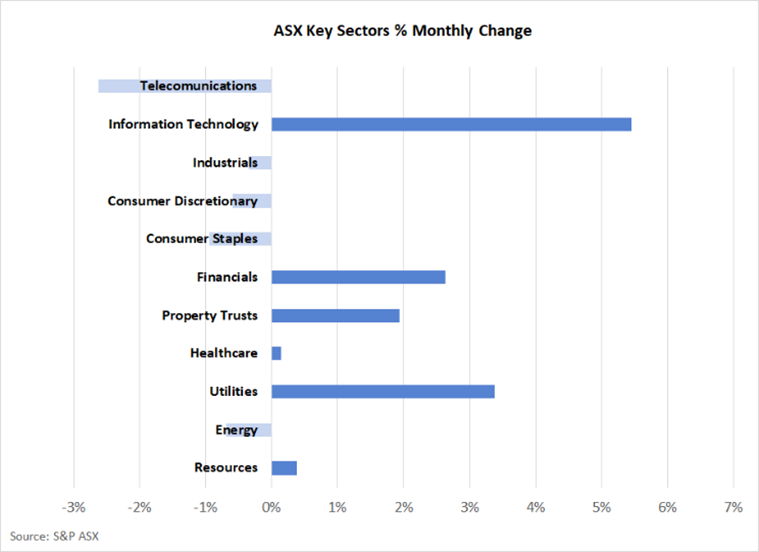
The Australian share market underperformed the global average last month, with the S&P ASX 200 Index rising by just 0.9%. Weaker returns from resource and energy stocks contributed to the return differential, with a 6.0% fall in the oil price impacting energy related stocks. Although the iron ore price was 6.0% stronger, support for the major mining stocks was lukewarm, with Rio Tinto (down 1.2%) losing ground following a strong gain in April.
Consistent with the global trend, technology stocks were the best performed, with accounting software provider Xero (up 10.6%) making a strong contribution. Banks were also well supported with 3 of the major 4 banks providing half yearly updates. Lower than expected bad debts and the announcement of further capital management initiatives were well received by the market. In contrast, consumer stocks were negative over May, with further evidence that consumer spending across the Australian economy continues to weaken.
Fixed Interest & Currencies
Slightly better than expected inflation results in the United States, and marginally higher unemployment, improved prospects for a policy easing by the U.S. Federal Reserve this year. As a result, global bond yields declined last month. The U.S. 10-year Treasury Bond yield dropped from 4.69% to 4.51%. The reduction in the Australian equivalent was only minor though, with the 10-year yield here closing at 4.41%. Lower bond yields and supportive credit markets facilitated positive returns across most fixed interest investments last month.
Cash interest rates remained unchanged in Australia and the U.S.; however, the European Central Bank announced a 0.25% reduction in its cash rate to 3.75% in early June. This followed a 0.25% cut to 4.75% by the Bank of Canada. There remains speculation as to whether the Australian Reserve Bank will follow this policy easing trend. Both recent labour market data, which indicated a slight rise in unemployment, and economic growth data, which showed the Australian economy expanding by a tiny 0.1% in the March quarter, are potentially supportive of the case for lower interest rates. However, the RBA may be holding off any change to assess the impact of the personal tax cuts on spending and inflation.
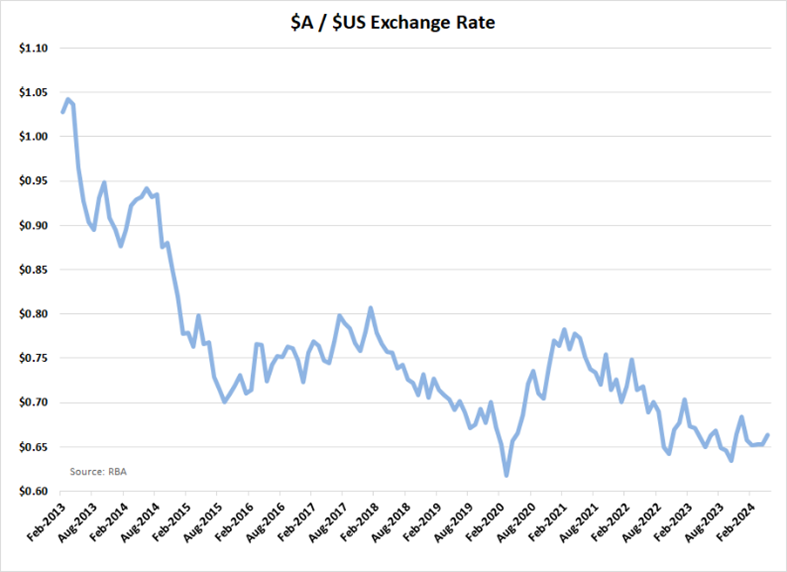
Lower bond yields in the U.S. did result in a slight weakening of the $US last month, with the $A appreciating from U.S. 65.3 cents to U.S. 66.4 cents. The $A was also firmer against both the Euro (up 0.6%) and the Japanese Yen (up 1.7%). Commodity prices and the improved prospects for China have been positive factors for the $A over recent months. However, trade fundamentals may become less supportive, with the Current Account moving into a deficit position in the March quarter. A weakening in the Terms of Trade (the ratio of change in export prices to import prices) was also contained in the Commonwealth Government’s Budget forecasts made last month.
Outlook and Portfolio Positioning
The notion that weaker economic news is positive for financial markets was reinforced in May. This “bad news is good news” phenomenon has generally always been the case for bond markets where weaker economic data triggers lower expectations for inflation and interest rates (resulting in rising bond prices). However, for equity markets, the notion is less intuitive. In theory, the value of a company’s share is the present value of all future earnings generated by that share. Future earnings should theoretically be sensitive to the broader economic environment in which a company operates. Increasingly it would seem, however, that earnings forecasts are detached from economic forecasts. If earnings are not sensitive to economic conditions, then weaker economic forecasts will increase equity valuations via the impact that lower interest rates have on the conversion of future income streams to a present value (the “time value of money” calculation).
There are various reasons as to why company earnings and the economic outlook may have become more detached recently, including the following:
- Global equity markets have become increasingly dominated by a small number of U.S. based technology stocks, where revenue is driven by more secular themes around technological advancement and long-term global market dominance than by short term economic cycles.
- A smaller percentage of economic activity is attributable to companies that are listed on stock markets, with privately owned companies taking on a larger share.
- Governments and government related entities have become larger in relative terms, thereby further diluting the relationship between overall economic growth and the earnings of listed companies. In Australia’s case, this growth in the size of the public sector was evidenced in last month’s Budget Statement that showed Commonwealth Government spending as a share of GDP at 26.6.% next financial year – materially above the 25.1% average that prevailed in the 10-years prior to the start of the COVID-19 crisis.
For portfolio positioning, there are some important implications of this apparent weakening in the relationship between overall equity market earnings and the broader economic cycle. Firstly, this phenomenon is likely to make equities and bonds more correlated, as both markets move in same direction to strengthening and weakening economic data – as we saw in both April and May. If so, the importance of having other sources of return and diversification through cash and alternative assets in portfolios is increased.
Secondly, attempts to forecast equity market returns and turning points become less dependent on a macro-economic perspective and more dependent on the specific earnings outlook of those sizeable individual companies making the largest contribution to equity market returns. As such, it would currently be difficult to have a meaningful assessment of the global equity market outlook, without having a strong understanding of the revenue drivers and risks associated with the large U.S. technology stocks. Over recent quarters, the market has been steadily upgrading its assessment of the outlook for these stocks, which is the primary explanation for why equity markets have performed so well, despite a relatively lacklustre global economic environment. Recent earnings results from these companies suggests these ongoing upgrades have been justified.
Important Information
The following indexes are used to report asset class performance: ASX S&P 200 Index, MSCI World Index ex Australia net AUD TR, MSCI World ex Australia NR Hdg AUD, FTSE EPRA/NAREIT Developed REITs Index Net TRI AUD Hedged, Bloomberg AusBond Composite 0 Yr Index, Barclays Global Aggregate ($A Hedged), Bloomberg AusBond Bank Bill Index, S&P ASX 300 A-REIT (Sector) TR Index AUD, S&P Global Infrastructure NR Index (AUD Hedged), CSI China Securities 300 TR in CN, Deutsche Borse DAX 30 Performance TR in EU. Hang Seng TR in HKD, MSCI United Kingdom TR in GBP, Nikkei 225 in JPY, S&P 500 TR in USD.
General Advice Disclaimer
Any advice contained in this document is of a general nature only and does not take in to account the objectives, financial situation or needs of any particular person. Any decision to invest in products mentioned in this document should only be made after reviewing the relevant Product Disclosure Statements. Past performance is not a reliable indicator of future performance. Varria Pty Ltd is an authorised representative of Charter Financial Planning ABN 35 002 976 294 AFSL number 234665